What Body Composition Readings on a Smart Scale Actually Mean
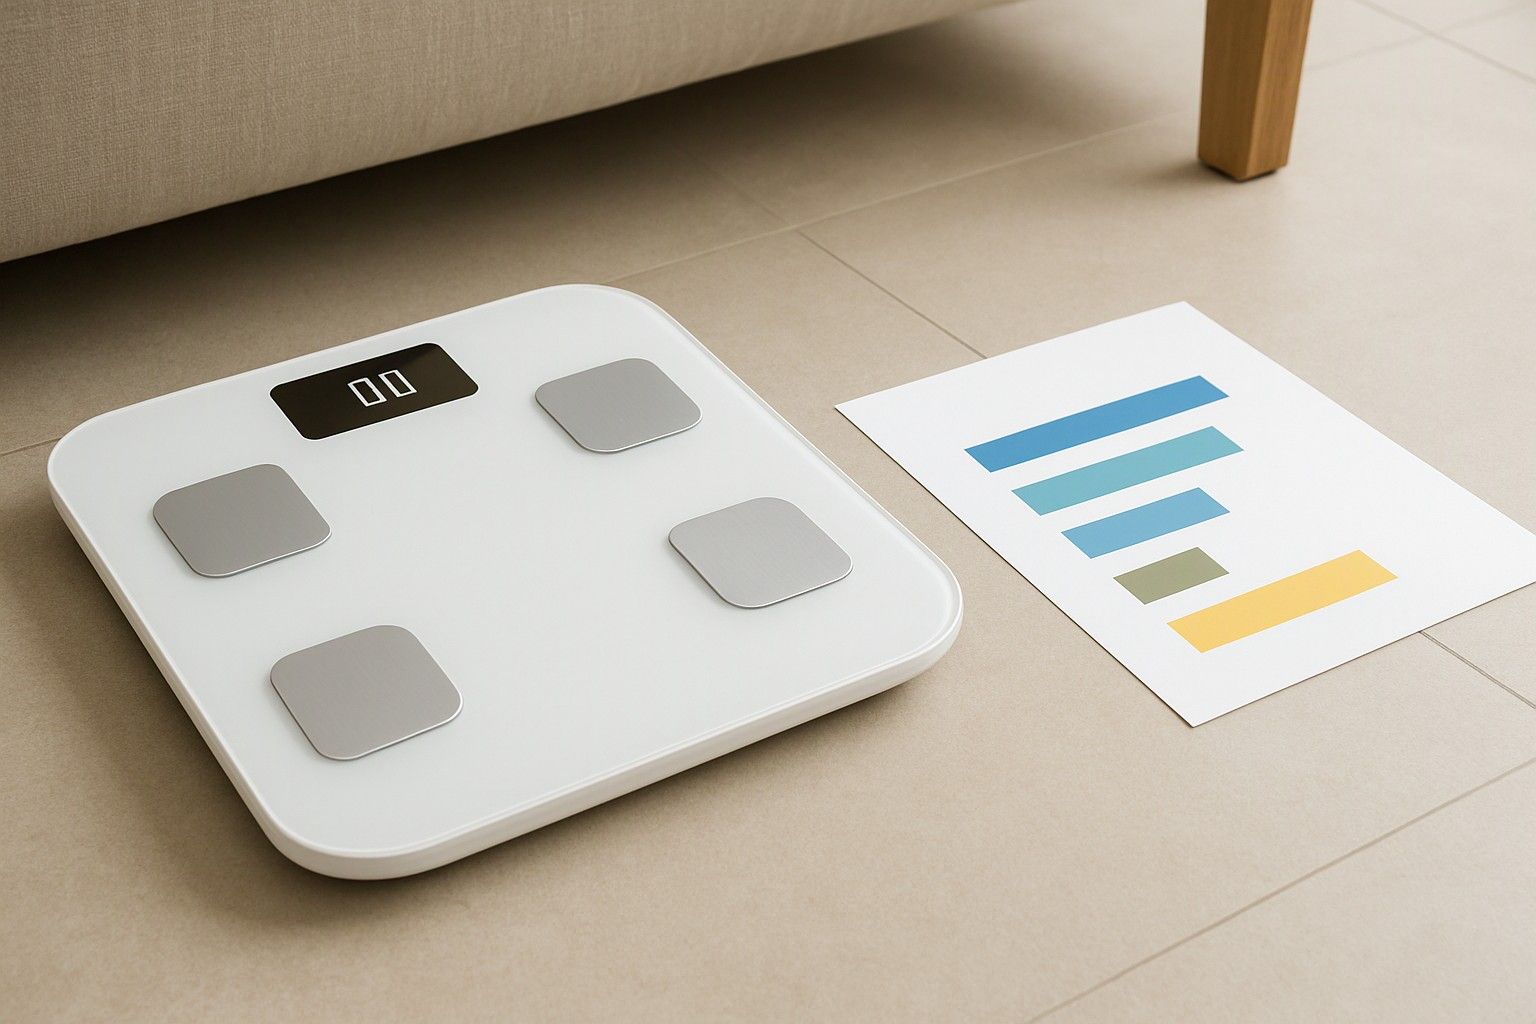
If your smart scale shows body fat, muscle mass, water and BMR next to your weight and you're unsure what to make of them, this article is for you. It is also for anyone deciding whether those extra metrics justify paying more for a scale. Short version: they are estimates, not lab measurements, and a few of them are far more useful than the rest.
How Bioelectrical Impedance Estimates Body Fat
Step on a body-composition scale barefoot and you'll feel nothing, but the metal pads under your feet are sending a very weak electrical current through your body. This method is called bioelectrical impedance analysis, or BIA. Water-rich tissue such as muscle conducts the current easily, while fat resists it. The scale measures that resistance (impedance) and works out how much of your body behaves like fat and how much like lean tissue.
The best of brands of smart scale also cannot actually see fat. It combines the impedance reading with your weight and with the height, age and sex you entered in the app, then runs those through a formula. Two scales with identical hardware can give different body-fat figures because their formulas differ.
The design matters too. Most home scales have electrodes only under the feet, so the current travels from one foot to the other through the legs and lower body. Your arms and torso are largely inferred, not measured.
Because impedance depends on how much water is in your body, the reading shifts with hydration, a recent meal, a hard workout, or the time of day. A single number is a rough guide. A reading taken under the same conditions week after week is where the value lies.
Metrics You'll See: BMI, Muscle Mass, Water, Bone and BMR
Here is what each figure on the screen or app means, and how it is arrived at.
- BMI: Weight divided by height squared. It needs no impedance at all. It says nothing about fat versus muscle. Indian clinical guidance for adults generally uses lower cut-offs than the global ones, flagging overweight from about 23 and obesity from about 25, because South Asians tend to carry more body fat at the same BMI.
- Body fat percentage: The share of your weight that is fat, estimated from impedance and your profile details.
- Muscle mass: Some scales report skeletal muscle, others total lean mass, and the two are not interchangeable. The app rarely explains which one you are seeing.
- Body water: The percentage of your weight that is water. It is the figure most affected by hydration on the day.
- Bone mass: Impedance cannot see bone. This number is modelled from your weight and profile, so treat it as a placeholder, not a measurement.
- BMR: Basal metabolic rate, the calories your body burns at rest. It is usually calculated from a standard formula using weight, height, age and sex, with little input from impedance.
Some scales add visceral fat, metabolic age or protein percentage. These are further layers of modelling on top of the same basic reading.
Which of These Numbers Are Genuinely Useful and Which Are Filler
Weight and body-fat percentage are the two worth watching, and what matters is the direction over weeks, not any single morning's figure. If your weight is steady but body fat is slowly falling and muscle is holding or rising, that is a real signal that an exercise or diet change is working, and a plain scale would miss it. Muscle mass trends are useful in the same way, as long as you don't compare across different scales.
Body water is useful mostly as a check on your own readings. If a figure looks odd, a low water number after a long fast or a hard session often explains it.
Bone mass, metabolic age and protein percentage are mostly filler. They are produced by formulas, can't be verified at home, and rarely change what you would do. BMR is harmless but also not unique to the scale: you can calculate the same figure yourself.
All of this assumes the weight reading underneath is right, and these estimates are only as good as the scale's underlying accuracy, so a scale that drifts or varies between steps will make every other metric unreliable. Also keep in mind that home BIA can be off by several percentage points compared with clinical methods such as a DEXA scan. Use it to track yourself against yourself, not against a chart.
Who Should Avoid Impedance-Based Readings (Pacemakers, Pregnancy)
Because BIA passes an electrical current through the body, it is not suitable for everyone. The current is very small, but manufacturers commonly advise against using body-composition mode if you have a pacemaker, an implanted defibrillator or any other implanted electronic medical device. The worry is possible interference with how the device works. If you or someone at home has one, check with the treating cardiologist before anyone steps on barefoot.
Pregnancy is the other common caution. Manuals usually recommend against body-composition measurement during pregnancy, and the readings would not be meaningful anyway, since body water and weight change in ways the formulas don't account for. Weight alone is fine to track if your doctor is monitoring it.
Other groups need to be careful with the numbers, even where there is no safety concern. Children and teenagers, people with swelling (oedema), people on dialysis and very muscular athletes can all get misleading results because the standard formulas are built around typical adult bodies. Many manuals set a minimum age for body-composition mode.
If anyone in the household falls into these groups, read the manual to see whether the scale can be used for weight only, and when in doubt ask a doctor.
How the Scale Sends These Readings to Your Phone
The scale itself is a fairly simple device. It measures your weight and the impedance, then sends the data to your phone, most commonly over Bluetooth. Some models use Wi-Fi instead. Depending on the brand, the scale or the app does the body-fat, muscle and BMR calculations. This is why the app profile matters: if the height, age or sex entered are wrong, every composition number will be off.
Most scales let several people create profiles and match each step to the right person by weight. This works well for family use, but two people with similar weights can get mixed up, so check how the scale handles that.
Some apps keep your history only inside their own app, while others can pass data to a phone's health platform. That affects whether your records stay with you if you switch scales or phones. We won't compare specific apps here, but for that you'll need to check app and phone compatibility before you buy, since an app that doesn't run well on your phone makes the metrics hard to use.
Deciding Whether You Need These Metrics at All
If your only goal is to know your weight, a basic scale does that job and you can skip body composition entirely. The extra metrics earn their cost if you are tracking fitness, exercise or a diet over months and want to see whether weight change is fat, muscle or just water. They matter less if you will weigh yourself once in a while or won't open the app.
Prices across this category run from ₹500 to ₹10,000, with an average of ₹999. Budget tiers sit at ₹600, ₹1,000 and ₹2,500. Think about how often you would actually use body fat, muscle and water trends. If it would be weekly, the extra cost is easy to justify against the price range. If it is once a month, it probably isn't.
Be realistic about what you will get. You are paying for a consistent trend tracker, not a clinical test. If you have a pacemaker or are pregnant, or if you want medically precise numbers, this feature is not the right tool. When you are ready to compare this against other factors such as size, display and power, revisit the full buying checklist to weigh this against other factors.
The numbers on a smart scale are model-based estimates, not direct measurements. Weight and body-fat or muscle trends over time are worth tracking, while bone mass and metabolic age are mostly decoration. You now know how the readings are produced, who should skip them, and how to decide if they are worth paying for.

Comments
Be the first to comment.